- OIL posted Q2 2025 revenue of VND40tn (+15% YoY) and reported NPAT-MI of VND181bn (+112% YoY). Core NPAT-MI also surged 132% YoY to VND175bn. This strong performance was mainly driven by (1) a 30% YoY increase in operating profit and (2) a 56% YoY increase in net financial income. The rise in operating profit was supported by (1) a 5% YoY increase in domestic sales volume and (2) higher regulated operating costs, which outweigh (3) the 23% YoY drop in Brent crude prices. In July 2024, regulated operating costs were raised by VND60/liter for gasoline (+6%) and VND140/liter for diesel (+14%), to VND1,140 and VND1,170, respectively. In addition, OIL noted that although the average oil price in Q2 2025 was 23% lower YoY, the intra-quarter price trend in Q2 2025 trended up unlike the downward trend in Q2 2024. This upward movement helped alleviate inventory pressure (see Figures 2 & 3).
- For H1 2025, OIL posted revenue of VND72.7tn (+13% YoY) and reported NPAT-MI of VND209bn (-35% YoY). Core NPAT-MI declined 34% YoY to VND199bn. The earnings contraction was primarily due to a 0.8 ppts drop in GPM, driven by a 16% YoY fall in the average Brent oil price, which heavily affected Q1 results. This margin pressure outweighed the 13% YoY growth in revenue and the 4% YoY increase in net financial income.
- We see upside potential to our earnings forecast, pending a fuller review, as H1 revenue and core NPAT-MI fulfill 69% and 57% of our 2025 forecasts, respectively. While H1 reported NPAT-MI reached 158% our 2025 full year forecast, we expect OIL to book provision expenses of VND247bn in H2 related to the bankruptcy of Phu Tho Biofuel, which may impact full-year reported earnings.
OIL may benefit from the industry’s switch to 100% E10 gasoline starting from January 1st, 2026. The Government is planning to mandate the nationwide use of E10 gasoline (gasoline blended with 10% ethanol) from January 1, 2026, in line with its emissions reduction commitments. Currently, only Petrolimex (PLX) and PV OIL (OIL) are equipped to pilot E10 blending and retailing (starting August 1, 2025), giving them a first-mover advantage. In contrast, other distributors may need to either (1) purchase pre-blended E10 from distributors such as OIL/PLX or (2) invest in new blending infrastructure. According to OIL’s management, to support stable market supply, the company also plans to offer blending services to other distributors and receive fees.
While the Government has not yet released a pricing mechanism or official guidance for this scheme, we believe petroleum distributors like PLX and OIL will benefit through margin improvement, as E10 is an internally blended, value-added product compared to traditional gasoline and diesel distribution.
Figure 1: OIL’s Q2 & H1 2025 results
VND bn | Q2 2024 | Q2 2025 | YoY | H1 2024 | H1 2025 | YoY | % of Vietcap’s 2025F |
Brent oil price (USD/bbl) * | 85 | 66 | -23% | 83 | 70 | -16% | 108% |
Gasoline price (VND/liter) * | 23,662 | 19,856 | -16% | 23,508 | 20,320 | -14% | 111% |
Diesel price (VND/liter) * | 20,362 | 17,677 | -13% | 20,437 | 18,303 | -10% | 116% |
Domestic sales volume (mn m3) | 1.40 | 1.46 | 5% | 2.76 | 2.76 | 0% | 51% |
Revenue | 34,708 | 39,954 | 15% | 64,332 | 72,743 | 13% | 69% |
Gross profit | 1,078 | 1,154 | 7% | 2,255 | 1,985 | -12% | 53% |
Selling expense | -724 | -740 | 2% | -1,467 | -1,371 | -7% | 52% |
G&A expense | -262 | -295 | 13% | -564 | -528 | -6% | 57% |
Operating profit | 91 | 118 | 30% | 224 | 87 | -61% | 48% |
Financial income | 174 | 229 | 32% | 381 | 401 | 5% | 60% |
Financial expenses | -142 | -103 | -27% | -193 | -204 | 6% | 46% |
Interest expenses | -45 | -73 | 63% | -83 | -140 | 69% | 51% |
Profit/(loss) from JVs, associates | 6 | -1 | N.M | 10 | -2 | N.M | N.M. |
Other income/loss | 10 | 5 | -45% | 17 | 9 | -45% | N.M. |
PBT | 140 | 249 | 78% | 439 | 291 | -34% | 153% |
Income tax | -39 | -48 | 23% | -94 | -64 | -32% | 168% |
Reported NPAT-MI | 85 | 181 | 112% | 319 | 209 | -35% | 158% |
Core NPAT-MI | 75 | 175 | 132% | 302 | 199 | -34% | 57% |
|
|
| Δ ppts |
|
| Δ ppts |
|
Gross profit margin % | 3.1% | 2.9% | -0.2 | 3.5% | 2.7% | -0.8 |
|
Sales & marketing % sales | 2.1% | 1.9% | -0.2 | 2.3% | 1.9% | -0.4 |
|
General admin % sales | 0.8% | 0.7% | -0.0 | 0.9% | 0.7% | -0.2 |
|
EBIT Margin | 0.3% | 0.3% | +0.0 | 0.3% | 0.1% | -0.2 |
|
NPAT-MI margin | 0.2% | 0.5% | +0.2 | 0.5% | 0.3% | -0.2 |
|
Core NPAT-MI margin | 0.2% | 0.4% | +0.2 | 0.5% | 0.3% | -0.2 |
|
Source: OIL, Vietcap (*average prices)
Figure 2: Platts Singapore price movement (reference point for Vietnamese petroleum retail prices), excluding the impact of the petroleum stabilization fund (USD/bbl)
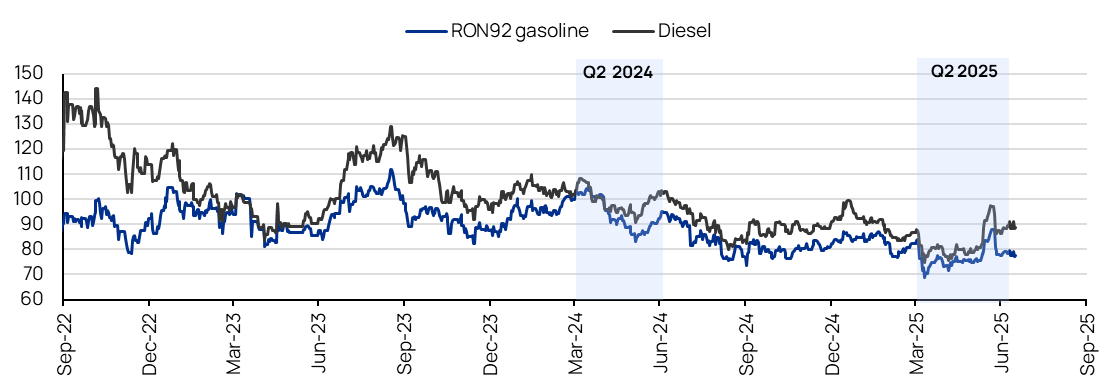
Source: Ministry of Industry and Trade, Vietcap (data as of July 22, 2025)
Figure 3: Vietnamese E5 gasoline and diesel retail prices, including the impact of the petroleum stabilization fund (VND/liter)
|
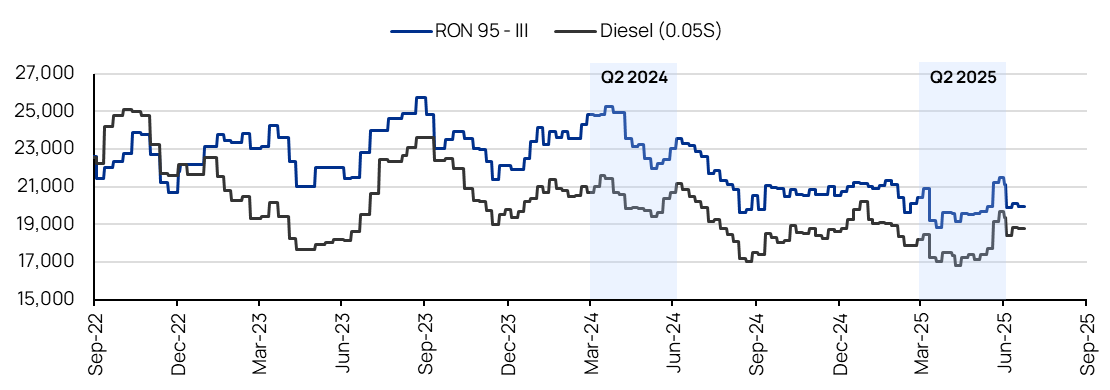
Source: OIL, Vietcap (data as of July 22, 2025)
Powered by Froala Editor